Even though Elliott created this theory in 1938 for the stock market, this theory remains a popular form of technical analysis that many cryptocurrency traders follow today. If you’re a crypto trader, you can add chart reading the list – it’s our bread and butter, you can’t avoid it.
Like many new strategies and market analysis, the Elliott Wave Theory will take time to master, and it’s always important to do your due diligence when trading – but hopefully, this guide helps you next time you’re chart gazing.
One skill of effective chart reading is using the movements of a cryptocurrency’s price to predict future changes, also known as
technical analysis. A popular form of technical analysis you can use when analyzing the charts is the Elliott Wave Theory.
What is The Elliott Wave Principle?
The theory was first coined by accountant Ralph Nelson Elliott in 1938. He identified a pattern within the stock market, stating his
findings in his book, ‘The Wave Principle.’
Eliott theorized that the price movement reflects the collective trader’s psychology, resulting in ‘mood swings’ found in any market
trend, causing patterns. These patterns followed consumer psychology and sentiment in two waves; a motive and a corrective wave.
Of course, we’re not giving Elliott great credit with this description, and there’s a lot more to it than just these two waves, but we’re covering the basics here.
The Basics Of The Elliott Wave Theory
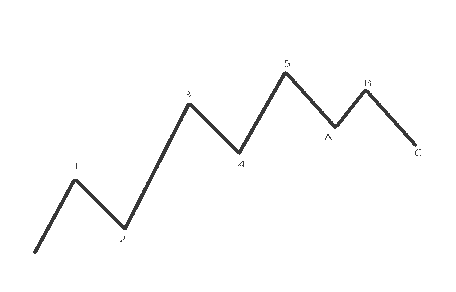
The image is an example of the Eliott Wave cycle in its most common form – a ‘5 Wave Pattern’. This is a signature synonymous with this cycle. In this pattern, you can identify both motive and corrective waves.
You can identify motive waves within the pattern, numbered 1-5. Motive waves can be split into two types, impulse or diagonal waves – but we won’t get too deep into this at the moment.
What we will get into, though – is a quick breakdown of a motive wave. Think of waves 1, 3, and 5 as the driving waves, reflecting the market trend, and waves 2 and 4 as slight corrections to movements.
Motive ways always have rules that accompany them (which make it easier for you to spot and use for your analysis). These are :
- Wave 2 never retraces Wave 1 by more than 100%
- Wave 3 is never the shortest out of Waves 1, 3 and 5.
- Wave 4 never overlaps Wave 1.
Corrective Waves can be identified in the image above by their letters, A, B and C. However, they can be a little more tricky to locate than motive waves, as they can often be misinterpreted as overlapping with other trends in the market.
A corrective wave, in our example, is a three-wave pattern that is against the current trend, forming a mini ‘counter-trend.’
Elliott initially identified over 21 patterns in a corrective wave, including the Zig-Zag, Triangle, Double-Three, and Triple-Three patterns but we’ll leave these for another time.
Here are some other technical analysis articles I’ve made for you: