Learning how to do technical analysis on the (RSI) Relative Strength Index is one of the most useful technical analysis tools a crypto trader can use.
In simple form, the Relative Strength Index measures a cryptocurrency’s price over 14 periods (which can be weeks, months – to the exact minute), analyzing the speed of these movements within the 14-period timeframe.
Essentially, the RSI measures the changes of prices and the speed at which a cryptocurrency moves within the 14-period timeframe to identify overbought and oversold market conditions.
Don’t worry, though – we’ll get into the nitty-gritty of the (RSI) Relative Strength Index later, so you’ll be quite prepared when adding this widely used tool to your technical analysis arsenal.
Now it’s time to answer the most crucial question – how do you use the Relative Strength Index?
How do you use an RSI indicator?
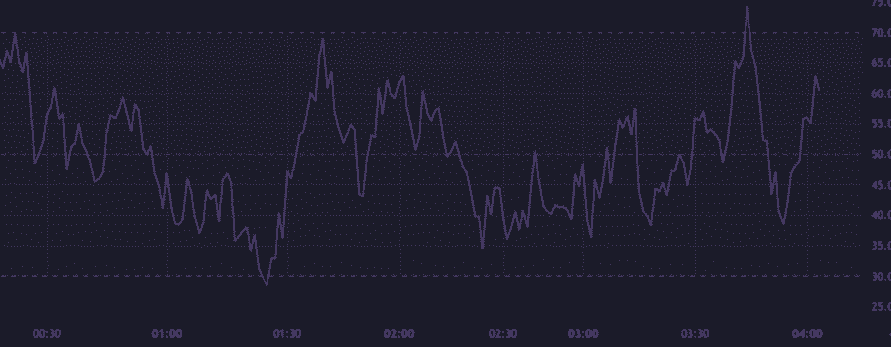
Above, you can see a line graph for 14 hours charting Bitcoin. We’ll use this as our example moving forward.
Most trading platforms will automatically apply the RSI values, so you won’t need to do this manually. Instead, there’ll be a small icon labeled “Strategy/Investment/Analysis” (which differs on which platform you use to trade) that will apply the values automatically.
You can use the RSI to identify if a cryptocurrency is oversold or overbought.
Overbought V Oversold: The 70/30 Model
Traditionally, the RSI can simplify if a cryptocurrency is overbought or oversold, in what is known as the
70/30 model: RSI above 70: Bitcoin is actively purchased in the market and signifies a bullish trend
RSI below 30: Bitcoin is losing interest within the market, and selling pressure is growing, signifying a
bearish market trend.
There are other variations of the 70/30 model, including using 80/20 and even 85/15 indicators – however, a market can rarely remain stable with its current momentum below 20 and above 80.
As the Relative Strength Index is a momentum oscillator, the RSI will swing anywhere between 0 -100.
Of course, it’s essential to use the Relative Strength Index is one of your many technical analysis strategies, as using this solely can paint an ineffective exit or entry plan.
Here are some other technical analysis articles I’ve made for you:
- Eliott Wave Theory in technical analysis
- How to swing trade cryptocurrency
- What is the Bull Trap?
- What is the rising wedge?
- How to trade the head and shoulders pattern?
- How to be a Bitcoin millionaire
History of the Relative Strength Index (RSI)
To use the Relative Strength index effectively, it’s helpful to brush up on the history behind the model.
Like most technical analysis tools, the RSI was initially developed for the stock market. It was created by J.Welles Wilder Jr, who developed the idea in his 1978 book, “New Concepts in Technical Trading Systems”.
J Welles Wilder Jr also developed the Average Directional Index, Parabolic SAR and Average True Range technical indicators, tools widely used today, and is why many consider the American as the father of technical analysis.
Okay, maybe that’s a term I’ve penned – but after Welles Wilder Jr’s passing in April of 2021, his legacy and importance on the traditional and modern markets should not be forgotten.
