Support And Resistance: A Short Guide on how to use support and resistance when trading
Technical analysis can be a scary term if you’re beginning your journey into trading cryptocurrency.
And there are some very complex concepts and strategies to master in this market, yet before you begin to research these topics, it’s
always good to start at the basics.
One fundamental concept of technical analysis is support and resistance, having a basic understanding of approximate tops and bottoms when ranging sideways does help with the emotional rollercoaster of trading.
What is Support & Resistance?
The cryptocurrency market is volatile – that’s something both experienced and new traders are aware of when analyzing conditions.
As the crypto market can be affected by trader and public sentiment, like traditional markets, it can be difficult to predict movements and trends across a period. Support and resistance are some of the many technical indicators traders can use to predict movements in the market.
Trading the Support
Support in the market refers to a level that the price finds a supportive ‘floor’ on. This is the zone the price will average itself across the market trend, showing signs of movement without dipping.
This occurs when a coin (we’ll use BTC as our example) receives sufficient demand from traders buying in. This creates a supportive zone, as the price cannot drop due to adequate buying demand.
Trading the Resistance
Resistance in the market refers to the price level that cannot pass. This acts as a barrier to the price, causing resistance to the current trend. This is affected by reduced demand for BTC and an increased supply.
For this reason, you can understand why support and resistance indicators play a big part in the savvy crypto trader’s strategy.
How Do I Read Support And Resistance Levels On A Crypto Chart?
There are many ways you can read support and resistance levels on a crypto chart, with each known as a ‘technical indicator’.
You can often find these presets in your chosen chart’s settings or draw them yourself by visually identifying trends. For example, here are two possible ways to read support and resistance levels on a crypto chart:
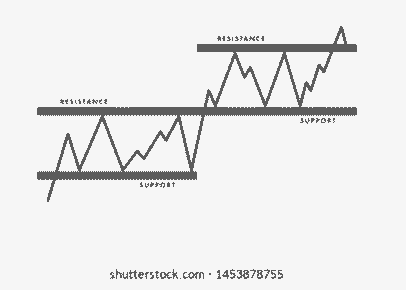
The Horizontal Line Graph
The horizontal line graph is one of the easiest ways to identify support and resistance, and it can all be done without too much analysis.
You can simply plot the points on the chart where you identify a ceiling the price cannot break (resistance), and the floor the price doesn’t drop beyond (support).
Simple Moving Average
The simple moving average indicator (SMA) is another visualizer to identify when reading cryptocurrency charts. The moving average indicator gives crypto traders a general view and health of the current market.
You can select a specific period to analyse when using moving averages to track price movements, from minute intervals to a broader, year-long moving average.
This is a simple moving average chart – if you’re looking for a more profound and technical process to engage with when implementing moving averages into your strategies, consider using an exponential moving average indicator (EMA).
Here are some other technical analysis articles I’ve made for you:
- Eliott Wave Theory in technical analysis
- How to swing trade cryptocurrency
- What is the Bull Trap?
- How to trade the relative strength index (RSI)?
- What is the rising wedge?
- How to trade the head and shoulders pattern?
- How to be a Bitcoin millionaire
Support & Resistance
Support and Resistance levels are essential components for more complex technical analysis strategies and but also as a good stepping stone into these concepts.
By adding these visual aids and tools into your crypto trading approach, you’ll be able t identify perfect positions to influence the market and, more importantly – grow your crypto portfolio!
